2020 Q2 Review and Outlook
The Nike Swoosh or the Square Root?
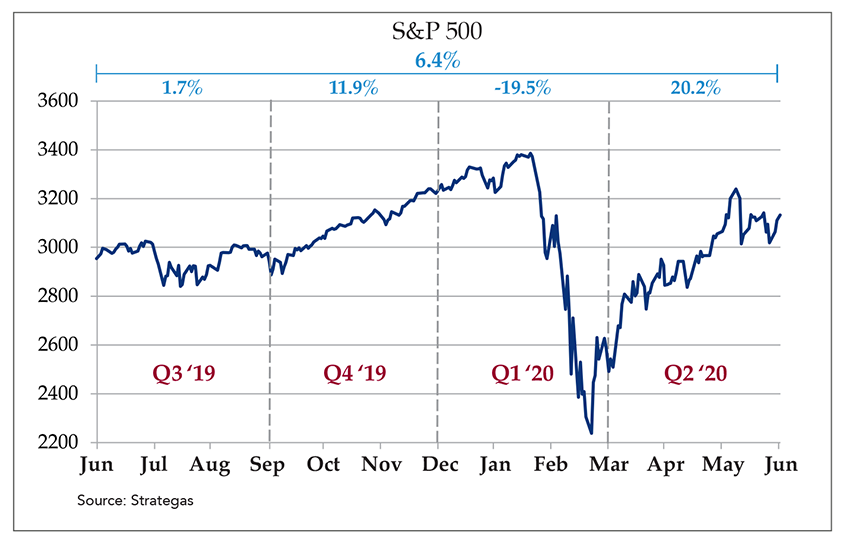
The U.S. stock market’s trend in the second quarter of 2020 was a mirror image of the first quarter’s, with the S&P 500 SPDR ETF (SPY) gaining 20.2% vs. a 19.5% drop in 1Q. The U.S. bond market (as measured by the US Aggregate Bond ETF – AGG) gained 3.1% (matching last quarter’s return), and a 60% stock/40% bond portfolio gained 13.3%, vs. a 10.4% decline last quarter.
Since the market dropped about 20% last quarter and gained 20% this quarter, a 100% stock investor should be back to where he started on January 1, 2020, right? Unfortunately, he wouldn’t, as portfolio that was invested 100% in the SPY on January 1st is actually down about 3.2% as of June 30th. This happens because a 1% loss hurts a little bit more than a 1% gain, and a 20% loss hurts a lot more than a 20% gain. It snowballs from there. To use an extreme case, an investor who records a 50% loss, then a 50% gain would be down 25% from where she started. It would take a 100% gain to completely erase a 50% loss.
The good news is that investors in balanced portfolios didn’t have nearly the same loss as a 100% stock investor in 1Q (due to the stabilizing force provided by the bond portfolio), and a 60/40 portfolio is up about 1.5% year-to-date. The 60/40 investor has also benefitted from rebalancing this year – if he had the stomach to trim his bond portfolio and buy stocks at the end of March, when COVID-19 really started to hit its stride and the STOP button was pressed on the economy. By comparison, an identical but non-rebalanced portfolio would only have risen about 0.6% in the last six months. Getting an extra 0.9% per year doesn’t sound like a lot, but it compounds over time.
The nice part about setting an asset allocation and rebalancing is its simplicity. In this case, the investor that rebalanced garnered an extra 0.9% return, just by following some rules. There was no need to watch CNBC (other than for entertainment), listen to “market strategists,” or attempt to forecast the short-term direction of the market (which is impossible anyway). The portfolio told you what to do, not the talking head with a track record no better than a coin flip, or your “hunch,”or your brother-in-law’s conspiracy theory.
As we noted in our previous first quarter update, we have also been looking within the asset classes to make sure the stocks/bonds/ETFs are appropriate, especially looking to weed out stocks with the highest risk of not coming back after COVID-19 finally runs its course. We have also been sifting through the debris, looking for great businesses that we have wanted to own but couldn’t get a decent price – until now. And, as always, we pay attention to clients’ personal financial picture, adjusting for big life events. If someone just lost her job or had to close her business, then her investment policy probably needs to change.
Now that the stock market has recovered most of the lost ground, what lies ahead?
In our last update, we went back to 1st grade and reviewed our alphabetical skills to visualize the possible economic scenarios unfolding in the wake of the pandemic. The four key letters are (in order of worst to best) – L, U, W and V, with the path of the economy following the shape of each letter. For example, the most negative “L” shape is a sharp drop with no recovery for the foreseeable future, while the most positive “V” shape describes a sharp drop with an equally sharp rebound.
While the stock market has initially voted “V,” we still believe the answer is somewhere in the middle. In fact, the ultimate shape could be very different from the more clear-cut letter patterns. We have seen market analysts suggest the “Nike swoosh” shape (a steep drop with a long but steady climb) and even the “square root” (an abbreviated “V” with a long flat period afterward.)
The economic scenarios are also complicated by the uneven progress in slowing the spread of COVID-19. Northeastern states such as New York and New Jersey were hit extremely hard at the outset, but are now re-opening. However, there are new hotspots in the south and west, with Florida, Texas and Arizona slowing, stopping or even reversing the re-opening process.
With all that said, here are the key factors we are watching over the balance of 2020:
1) Progress (or lack thereof) containing the spread in the U.S. With the spotlight on the large southern and southwestern states, it bears watching data that go beyond case counts, such as hospitalization rates and death rates, as they drive the pace of loosening/tightening controls on businesses (and therefore economic activity). While the case counts in these states have been exploding, the hospitalization rates and especially death rates have been growing more slowly. It could be a reporting lag, or it could reflect more favorable demographics and/or healthcare practices, which would mean a slightly better scenario.
2) Development of infrastructure to ultimately prevent/treat the virus, such as rapid testing and vaccines/treatments. There have been many headlines about progress with a vaccine and/or treatment. We expect this to be a slow grind of hits and misses, albeit with continued progress. We are keeping our expectations low. Everything takes longer than you expect in this area.
3) Government stimulus. The government has tried to plug the gaping hole in the economy, rolling out programs from the Treasury and the Fed (CARES Act, PPP lending and bond purchases/zero Fed Funds rate, to name a few). Since some parts of the CARES Act will be expiring soon, Congress is debating a renewal of all or part of these programs. Ironically, the resurgence of COVID-19 may trigger more generous programs than originally expected, which could mitigate some of the worst-case economic scenarios.
4) It’s an election year. One thing that people of every political party can agree on is that politicians want to be (re)elected, and election years have historically shown an increasing willingness for incumbent politicians (particularly incumbent presidents) to write big checks to get votes. The fact that hard-hit Florida is one of the most important states in the upcoming presidential election may help speed up the check-writing process.
So we have two factors that are most likely hurting the recovery (new virus hotspots and no clear path to vaccine/treatment on the horizon), but two factors that could help mitigate the worst outcomes – a possible second round of stimulus with an increasing sense of urgency to write checks spurred by the upcoming elections. Economic activity has bounced a bit off the worst levels, so these factors will either sustain the momentum upward, or grind everything back to a standstill.
As we continue to say, none of this is predictable in the short term, and regardless of which shape the economic recovery takes (L, V, X, Nike, Puma, Adidas, square root, sine wave), we believe that diversification and maintaining the asset allocation that is appropriate for your needs is still the best strategy. Staying with your asset allocation and rebalancing over the past six months would have provided a small but significant boost to your results this year, and it is these seemingly minor and boring habits that should compound and pay increasing dividends over time.