2022 Q1 Review and Outlook – Stocks and Bonds and Yield Curves, Oh My!
2022 got off to a rocky start as stocks (as measured by the S&P 500 SPDR ETF – SPY) lost 4.6% in the first quarter. Surprisingly (or perhaps not surprisingly) the U.S. bond market (as measured by the US Aggregate Bond ETF – AGG) was down 5.9%, and a 60% stock/40% bond portfolio lost 5.1%. Over the past twelve months, stocks gained 15.5%, bonds lost 4.3% and a 60/40 portfolio gained 7.6%.
Figure 1: S&P 500 quarterly performance, trailing four quarters.
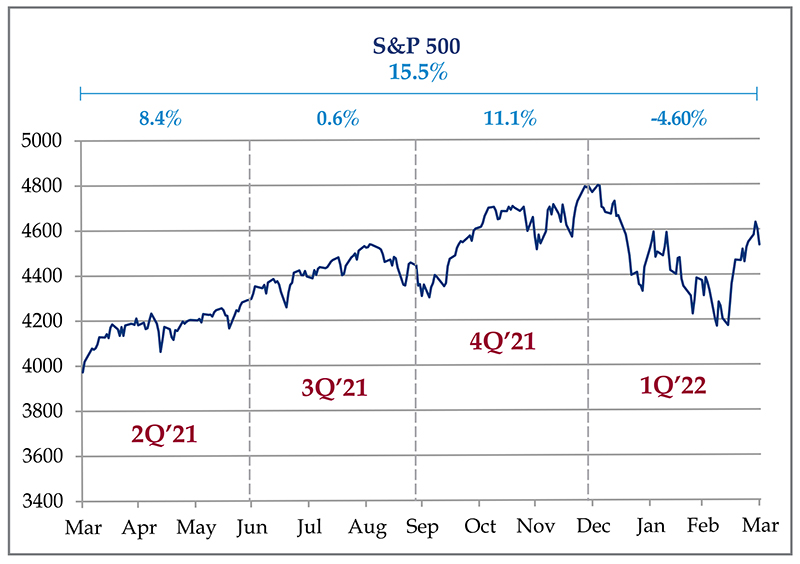
Source: Strategas, Portfolio Visualizer
Ukraine.
Okay, who had “Russia invades Ukraine” on their 2022 Bingo card? While many geopolitical analysts have long suspected Vladimir Putin of wanting Ukraine all to himself (as part of a larger strategy to put the Soviet Union back together), no one expected the scale of the invasion in late February. Even when the tanks and troops massed on the borders, many people thought that it was just posturing to gain leverage over Western Europe and NATO.
And now our stock portfolios are wallowing in misery, as the war in Eastern Europe sent the stock market spiraling down…wait, no actually the S&P 500 rose about 5% from first day of the invasion to the end of the quarter. Although Russian stocks are effectively worth zero until the Russian stock market re-opens (if it ever re-opens), this is yet another example of financial markets not doing what they “should” do in a major world event.
The war in Ukraine is also a prime example of why we don’t issue short-term market forecasts. A lot of investment firms do. Some much bigger and perhaps smarter (or smarter sounding) than us write them every year, and we read a lot of them, so you don’t have to. But there are always unforeseen events that in hindsight make those predictions worthless. The unpredictable nature of the future is also why we stay diversified – including owning international stocks – and take a long-term view. Long-term stock returns incorporate recessions and wars and peace and expansions and good presidents and bad ones and moon landings and technological developments and obsolescence, etc. It’s also why we don’t “position the portfolio” based on our prediction of what we think the world will look like over the next year or two.
Interest Rates – What’s up (or down) with bonds?
You may have noticed something in the performance statistics in the first quarter – both stocks and bonds had negative returns. Furthermore, bonds were down more than stocks. Stop the presses! Aren’t bonds supposed to tread water or even rise in value when stocks go down? Isn’t that the entire reason why we diversify our portfolios – trading lower returns in bonds for more stability? Is it time to stock up on canned food, ammunition, and gasoline?
No, the laws of investing have not been violated. Stocks and bonds can and will move in the same direction over any given short-term period. The movement in bond prices does have a low correlation with stock prices over a long period of time, but even assets with zero correlation to each other will move together from time-to-time.
Also, there is a matter of degree. In a typical recessionary bear market, stocks will fall 30%-50% over the span of 18 months or less (as we saw during the financial crisis and the COVID bear market). Investment-grade bonds will only fall a fraction of this amount, because, ultimately, the bonds have an expectation of being fully repaid at par value, while stocks are open-ended investments. A stock’s “par value” is whatever the market will pay when you go to sell the shares.
While rising interest rates do negatively affect bonds (as they have during the first quarter), an intermediate-term bond portfolio might lose only about 5% of value for every one percentage point increase in interest rates. Furthermore, an increase in interest rates means that the interest payments can be reinvested at higher rates, which would increase long-term returns across a bond portfolio.
Corporate and/or municipal defaults will hurt performance (especially in a recession), but investment-grade corporate bonds are issued by highly profitable, resilient companies that don’t have a lot of debt to begin with. Likewise, investment-grade municipal bonds have either the backing of tax revenue or a steady stream of municipal revenue (e.g., a water plant) and many have insurance that will pay investors in the event of a default.
Generally, investors who get in trouble with bonds in a rising interest rate and/or recessionary environment take too much risk to get higher yields, either by investing in very long-duration and/or high default risk bonds. For example, while a 10-year corporate bond may drop 5%-6% for every 1% rise in interest rates, a 30-year bond could drop 15%-20% for the same interest rate movement. A “junk bond” portfolio with a juicy 5% yield (much higher than an investment grade bond) could have a 5% or even 10% default rate in a recession, which would wipe out all of that “high yield” and more.
There are a lot of ways to build a bond portfolio, and we prefer to be very “vanilla” with ours, because we prefer to take our risks in the stock market – which, over the long term earns much higher returns than bonds.
The Yield Curve – the Prophet of Doom?
The other recent interest rate-related news is the dreaded “inverted yield curve.” Although many economists have different benchmarks, the most commonly watched relationship between treasury bonds of different maturities is the 2-year vs. the 10-year yield. 95% of the time, an investor earns a lower yield on a 2-year bond than a 10-year bond, which makes sense. Why would you lock up your money for 8 additional years, only to get a lower yield? So, a lot of people take notice when the curve inverts like this – it means that something strange is going on in financial markets, and a recession has historically followed an inverted curve more often than not.
On April 8th, the yield on a 2-year Treasury Note was about 2.9%, and the yield on a 10-year note was 2.7%. What does this mean? Maybe nothing, maybe something. What we do know is that the Federal Reserve has started the process of increasing short-term interest rates but has not been as active in raising longer-term rates (which it has been holding down for several years via a program called “quantitative easing”).
Historically, the 2-year yield has been a decent predictor of where the Fed Funds rate (currently at 0.25%) settles after a series of Fed actions, and the 2-year yield is currently indicating that the Fed is going to hike short-term rates to between 2.5% and 3% (which is a lot of hikes!) The long-term bondholders have a much fuzzier signal – is the Fed going to stop buying 10 to 30-year bonds or just slow down? What is the economy going to look like when the Fed is done hiking short-term rates? If the economy slows down, then investors may buy longer-term bonds in a “flight to safety,” which would push yields down. As a result, the 10-year yield is rising, but not as fast as the 2-year yield. This analysis is also confounded by the global nature of interest rates. While a 2.7% yield on a 10-year treasury bond is low by historical standards, there are still trillions of dollars of foreign bonds that have negative yields.
Bond yields also give you some clues about inflation, since bonds perform poorly in a high inflation environment. 2-year yields rising above 10-year yields implies (but does not predict!) that the long-term inflation rate may be lower than inflation over the next few years.
None of these intricacies really matter to the average person. What matters is what may happen to the “real economy” and therefore the stock and bond markets. Our educated guess, based on history and current events, is that the rate of economic growth will most likely slow down over the next 12-24 months – which is exactly what Chairman Powell wants. Inflation has become a problem and is becoming less “transitory” each quarter as companies raise prices and wages. While we continue to believe that supply issues will eventually sort themselves out over time, the more structural aspects of inflation will become a problem unless demand cools a bit in order to let supply catch up. “Demand cooling a bit” can mean a lot of things – everything from a full-blown crisis (2008-2009), a more typical recession (1990-1991 or 2001-2002) or even the famous “soft landing” in the mid-90s. We are hoping for a soft landing but wouldn’t be surprised if there were a moderate recession either. There just isn’t enough information to tell.
Does that mean we should sell everything if the economy is almost certainly going to slow down?
Short answer, “no.”
Longer answer…”no,” for a few reasons.
1. First, if a recession hits, it usually takes at least 12 months to get here from the date of yield curve inversion, and a lot can happen in a year.
2. Second, remember those bonds in your portfolio that are currently falling in value? If a recession hits, then interest rates will most likely start falling again, which will increase the value of your bond portfolio and help stabilize the value of the stocks (which will most likely fall in value).
3. Third, when do you get back in? The stock market is very clever – usually people who wait for the “all clear” signal will buy back much, much higher than the bottom – maybe even a higher point when they sold. We have seen this happen many times before.
4. Fourth, in a “soft landing” scenario, stocks would most likely take off (as they did in 1994-1995), leaving everyone that sold in the dust. (See point #3 above.)
As we are fond of saying, a portfolio that is properly constructed and diversified and which matches up with a sound financial plan is already set up to handle the inevitable recession/bear markets. If you would like help creating or updating a financial plan, please contact us.
Inflation – “Transitory” sure is taking a long time!
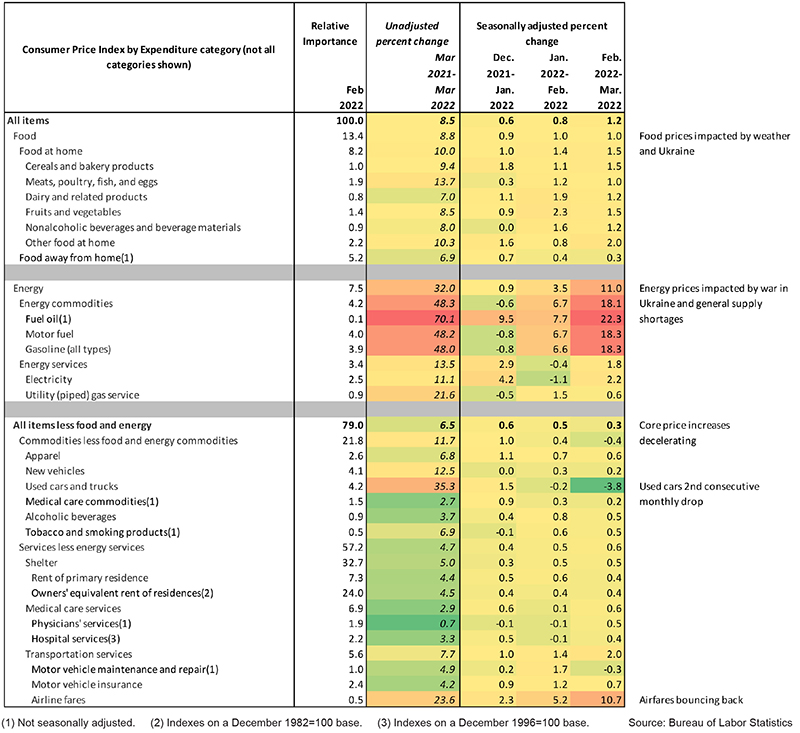
As we mentioned in last quarter’s update, we will probably be following inflation for a while, because it will be with us for a while. Figure 3 provides the latest numbers, and they look a lot like the data from three and six months ago – a big spike in energy prices combined with higher prices on almost every other category.
However, a deeper look into the March data (released on April 12th) shows a few encouraging signs. While energy and food prices continue to climb rapidly, the “core” items (which make up 79% of the index and are generally less volatile) seem to be decelerating. Core prices increased 0.6% in January, 0.5% in February, but only 0.3% in March (which was also slightly lower than economists’ expectations). Much of the slowdown came from used car prices, which decreased 0.2% in February and 3.8% in March. In fact, core goods fell 0.4% which was the first decline in the past year. Nearly 30% of core goods have inflation under 2%, which is the best reading since last fall.
Now, 0.3% in a month is still 3.6% annualized, and energy and food aren’t trivial items! This is why the Federal Reserve still intends to increase rates for the foreseeable future to cool things down. As long as one of the largest oil producers in the world continues to lob missiles into Ukraine, energy prices (and certain food prices, such as wheat) will probably stay high, so a sustainably lower inflation rate is probably out of reach for the time being. But, a few categories of prices may be starting to improve as factories restart and the ports unclog.
As we have written before, stocks can be a great long-term inflation hedge, as companies can pass along their higher costs to the end consumer – which they have been doing quite actively this year. A word search for “price increase” or “input cost recovery,” on last quarter’s earnings conference call transcripts will show examples from almost every company that makes or sells a tangible good. Plus, energy and materials stocks have done very well over the past 12 months and should book outsized profits as oil and commodity prices stay high. This is why owning a variety of stocks in different industries and mixing in bonds based on overall risk tolerance makes sense for most investors in all economic environments.
We hope everyone has a safe and enjoyable Spring season (notwithstanding the yellow clouds of pollen) and we will be back in July with another update.
Figure 3: Selected Components of the Consumer Price Index (CPI), March 2022