2022 Q2 Review and Outlook – Welcome to the Bear Market
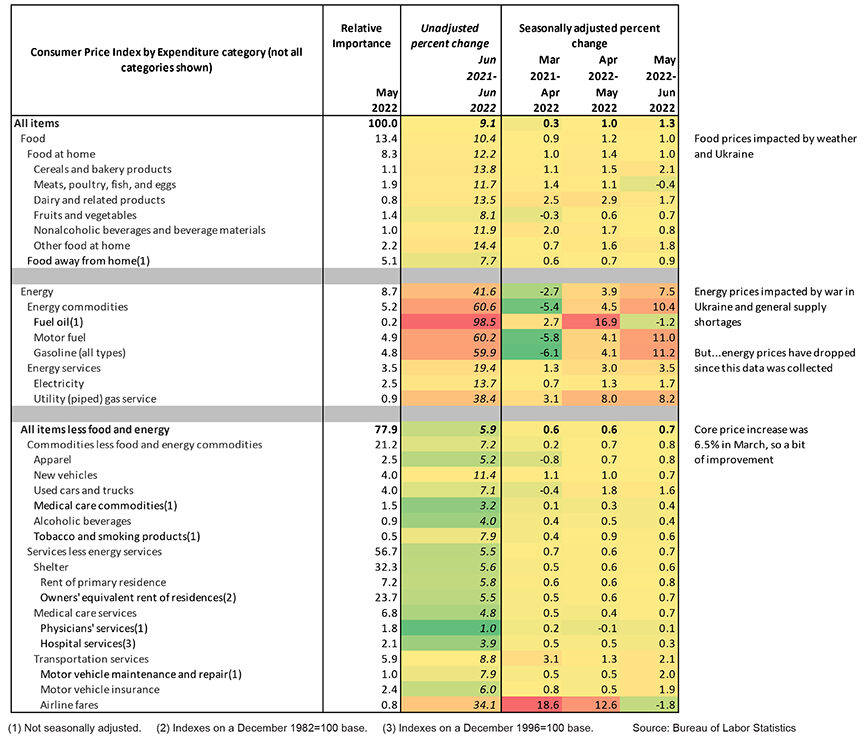
Financial markets continued their downward trend in the second quarter as stocks (as measured by the S&P 500 SPDR ETF – SPY) lost 16.1%. The U.S. bond market (as measured by the US Aggregate Bond ETF – AGG) fared a bit better, posting a -4.6% total return, and a 60% stock/40% bond portfolio lost 11.5%. Year to date, stocks lost 20%, bonds were down 10.2% and a 60/40 portfolio fell 16.1%.
Figure 1: S&P 500 quarterly performance, trailing four quarters.
Source: Strategas, Portfolio Visualizer
The Bear Market has officially arrived.
We have finally, officially crossed into a “bear market,” which is defined as 20% decline in a broad stock market index from its most recent high. (Scary roaring sounds play in the background.) The S&P 500 ETF hit its low point for 2022 on June 16th, which marked a 23% decline on a total return basis (i.e., including dividends) from the previous high on January 3rd.
So how does it feel to be fighting the big bad bear? For most people who have a decent percentage of their wealth invested in the stock market, it’s some form of “bad.” Of course, it depends a lot on age, risk tolerance and broader financial circumstances. We would argue that a 30-year-old who is regularly investing in their 401(k) should be jumping for joy and high-fiving their co-workers, because they are most likely a net buyer of stocks for the next 30 years, and finally get to buy something on sale (as opposed to houses, gas and cars). On the other hand, someone who is depending on their portfolio for the majority of their financial support and has 80%-100% of it allocated to stocks is most likely not jumping for joy, as they are net sellers of stocks, and selling stocks after a large drop could be damaging to a portfolio and a financial plan.
One thing we can be sure of is that the financial news has eagerly jumped on this event, and their graphic artists have been working overtime generating blood-red banners at the bottom of every screen screaming “MARKETS IN TURMOIL” or something similar. Unfortunately, bad news gets views and clicks, so whatever anxiety you may have when opening your account statements is unfortunately magnified by the talking heads on CNBC.
So, what should we do now?
Putting the bear market into perspective.
The first thing we need to emphasize is that “bear markets happen.” It is the cost of investing in stocks. One of our favorite sayings is “stocks go up, because they go down.” (One of our portfolio managers has this saying framed on his office wall.) No risk, no reward. If stocks never went down, no one would invest in anything else – it would essentially mean free money for everyone, and only the government can give free money to everyone. (Although that “free” money has a cost – you just don’t see it until you go to the grocery store, or try to buy a house or fill up your gas tank a year later.)
To put some numbers around this, we looked at the returns from the total U.S. Stock Market Index over the past 50 years. Coincidentally, 50 years ago the tech stock boom (then led by Polaroid, IBM and Digital Equipment Corporation) was losing steam, the economy was teetering on the brink of a stagflationary recession and stocks were about a year away from the 1973-74 bear market.
Someone who invested $100,000 into a 100% stock portfolio on January 1, 1972 and reinvested all dividends ended up with over $14 million (yes, $14,000,000) on June 30, 2022. This equals a 10.3% annual rate of return. Even though inflation averaged about 4% during these 50 years, that $14 million is still equivalent to $2 million in 1972 dollars, which equates to a 6.2% annual real return.
However, it wasn’t a smooth ride. Along the way, this investor experienced six peak-to-trough drawdowns of greater than 20% – with three of the six drawdowns exceeding 40% (1973-74, 2000-02 and 2007-2009). Furthermore, there were four additional “bear-ish” markets, with drawdowns ranging from 14% to 18%.
If you decided in 1972 that you couldn’t stomach any kind of drawdown and invested your wealth into T-Bills (a cash-like asset), your $100,000 would grow to about $940,000, which represents a 4.5% average annual return. That still sounds ok (especially considering the extremely smooth ride), but our old friend inflation averaged about 4% over this 50-year period, so that $940,000 is worth only about $132,000 in 1972 dollars – a piddling 0.56% real return.
Of course, most of us have diversified portfolios, and a relatively conservative portfolio consisting of 50% stocks and 50% cash (rebalanced annually) turned $100,000 into $4,489,000 ($630,000 in 1972 dollars) and only experienced
two peak-to-trough drawdowns worse than 20% (21% in 2000-02 and 26% in 2007-09). Substituting investment-grade bonds for cash would most likely have done even better, although the data doesn’t go that far back in time.
The stock market is very smart, but near-sighted.
Although we often tell clients not to focus on the short-term swings in the stock market, we do have a lot of respect for the market’s ability to sniff out major changes in underlying economic conditions. As we have mentioned before, the S&P 500 started falling in very early 2020 – long before COVID became a serious problem in the U.S. And, it bottomed in March 2020, when the caseloads and deaths were still accelerating across the world.
In this case, the stock market is telling us that the high inflation rates and more aggressive Federal Reserve are going to take a big bite out of economic growth this year.
So yes, “Wall Street” is very clever at figuring out what’s going to happen next year on “Main Street,” but it is very near-sighted. One-year returns tell us very little about the next ten or even five years. When the S&P 500 hit bottom in March 2009 (at the ominous price of 666), the economy was still in shambles and the unemployment rate would continue to rise for the remainder of the year. Few people had the intestinal fortitude to buy stocks at that point, because there was nothing in the economic data that gave anyone any hope. But, in retrospect, it was a generational buying opportunity.
What if the “long run” is now the “short run?”
So, all of that “putting things in perspective” may calm the nerves of people who won’t be needing to sell a lot of stock. However, for those who are retired or on the brink of retirement or who otherwise need their investment portfolio to support their lifestyle, a 20% stock market decline is painful, and we agree. The solution for these people is a bit more complicated than “stay the course and buy stocks on sale!,” but should still get them through tough times.
First, we stress in the strongest possible terms that people should not be taking any risk with money that is needed in the immediate short term (i.e., anything less than a year). It’s a really awkward conversation with your spouse when the $400,000 you saved for the down payment on your dream house turns into $320,000 because you had it all in stocks.
However, there is a big gray area between money you absolutely need “now” and money you don’t need until 20-30 years from now, and that’s where diversification comes into play. A mix of high-quality stocks across all the major sectors, and high-quality bonds of creditworthy companies or governments should be able to strike a balance between growth and stability. When stocks drop a lot, bonds will generally drop less (or sometimes even rise) and you can tap your bond portfolio for your living expenses, and maybe even buy some cheap(er) stocks with anything left over. If stocks go on a strong run, then you can enjoy the windfall and fund your Caribbean cruise with stock gains and add to your bond portfolio with what’s left of the excess returns.
As markets fluctuate over time and different economic cycles, periodically tapping into your strongest performing asset class and rebalancing into your weakest forces you to “sell high and buy low” through the ups and downs.
This naturally leads to the question of “how much in stocks vs. bonds,” and the answer is “it depends.” However, more conservative retirees can probably use 50/50 stocks/bonds as a starting point and the more growth-oriented and/or risk-tolerant could start with 60/40 or even 70/30.
It’s tempting to not want to take any risk (especially when the financial media is screaming about the impending recession) and just put it all into bonds or even cash, but that could be a big mistake, as a) you lose protection against inflation (which is definitely an issue right now) and b) you need some growth to get you through a longer period than you might expect. Based on current life expectancy tables, a 65-year-old retiree still needs to think about the “long term,” since 25% of 65-year-olds can be expected to live into their 90s – which means a 30-year time horizon.
For those who may be somewhere in the middle, putting together a comprehensive financial plan can be a great way to get comfortable with what your allocation should be. You can run scenarios of different asset allocations against your expected spending and see what mix of stocks and bonds will strike the best balance or risk vs. reward. Contact us if you would like to build a plan (or update an existing plan that may have gone stale).
But my bonds have gone down at the same time as my stocks!
Following up from last quarter’s update, stocks and bonds are both down year-to-date, which appears to throw a giant wrench into our diversification plan we just spent a lot of words describing.
We will not recap the entire section from last update, but will add a bit more context as to why we believe that a 60/40 or 50/50 portfolio is still “diversified.”
As we mentioned last quarter, stocks and bonds can and will drop at the same time, especially if interest rates rise sharply. However, even if stocks and bonds both fall by, say, 15%, stocks can easily fall another 15% (or 20% or 30%), while bonds (especially investment-grade short to medium term bonds) probably won’t keep falling down the stairs. Of course they could lose another 5%-10% of value, but down another 20%? It’s hard to make the math work on that.
Remember that the contract with the company doesn’t change because the price of the bond goes up or down – they still owe you the same exact same amount of interest payments and the same principal payment as when you bought the bond. As long as the company doesn’t default on the bond (which is why we don’t buy “junk bonds” to squeeze out extra yield), it doesn’t matter if the price of the bond falls from $100 to $80 – you are still getting back $100 when it matures.
Plus, higher interest rates mean that, over time (as long as interest rates remain high), the overall rate of return from your bond portfolio will increase, as you reinvest the proceeds of bonds that mature at much higher yields. For those of you who own bond mutual funds instead of individual bonds, you still get this benefit of reinvesting matured bonds at higher rates, because bond mutual funds are doing the same thing in their portfolios.
This is why we have been rooting for higher interest rates for a while. While bonds have provided some stability and diversification, their contribution to the overall portfolio returns has been (until recently) very little, and now they can start to “pull their weight” in terms of both stability and income.
Are we in a recession? Lots of mixed signals.
Judging by the news and general consumer sentiment, the country is in a deep depression. Fortunately, that extreme situation is not the case. In fact, we may not even be in a recession…yet. The first quarter GDP growth was negative, and the second quarter GDP (which hasn’t been reported yet) might also come in negative. While “two consecutive quarters of negative GDP growth” is a rule of thumb that many economists use to define a recession, The National Bureau of Economic Research (NBER) uses a much more complicated definition that includes considerable judgement. NBER also heavily weights data such as unemployment and personal income, and the unemployment rate is still at multi-decade lows.
Plus, looking at other household data such as savings balances and net worth, the average consumer is still in decent shape. They might be miserable because it costs $100 to fill up their tank and $300 to buy groceries, but a) they have a job (and may have just received a raise), and b) their bank account balance is probably as high as it’s been in years (thanks partially to the government “free money” that is ironically causing a lot of the current inflation).
This puts the Federal Reserve in a tough position, because other data is showing signs of weakness, so there are many mixed signals. For the time being, we believe that the Fed will prioritize combating inflation and will aggressively raise rates, with the hope that the consumer’s excess savings will give them enough of a cushion to ride out the continued slowdown in economic growth.
Remember not to pay too much attention to the economic data when thinking about investments – as we mentioned before, the stock market will probably move (up or down) long before the economy does. Those who put everything into cash “until things settle down/the coast is clear/etc.” usually miss the rebound in the stock market, because stocks don’t wait until the coast is clear.
Inflation – More of the same, but with a few twists.
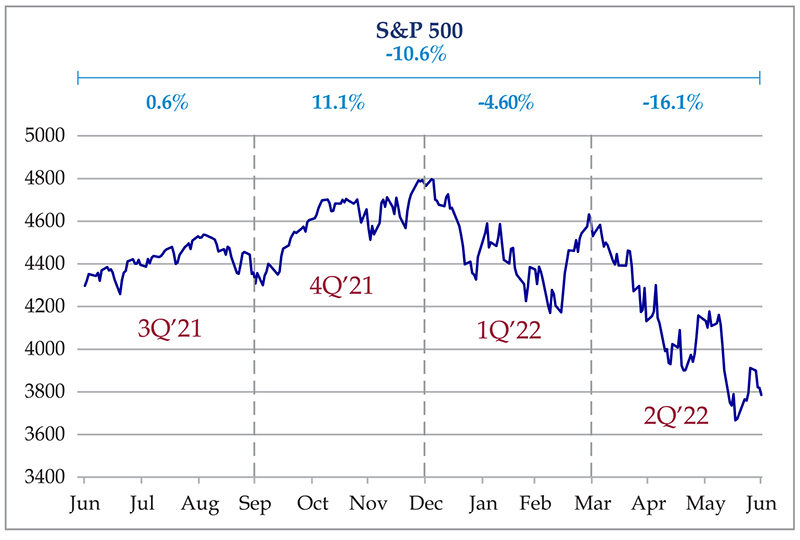
News flash – inflation is still high. The June CPI report showed a 9.1% year-over-year increase in average prices, which was also higher than most forecasts. Figure 2 provides the latest numbers, and they look a lot like the data from three and six months ago – a big spike in energy prices combined with higher prices on almost every other category.
However, the year-over-year increase in “Core” prices (i.e., without food & energy) was “only” 5.9%, which is lower than 6.0% in May and 6.5% in March. Although food and energy costs are very important to the average household budget, they are only 22% of the total cost of living index. Plus, the non-food and energy prices are usually less volatile than food & energy, which can often provide a better view of the underlying trend (which seems to be moderating a bit).
The other little wrinkle in this month’s report deals with timing. Although this is the “June” report, the prices are recorded in the middle of the month. It usually doesn’t make much of a difference, but for this month it does, especially in food & energy. You may have noticed that gas prices have dropped from “outlandish” to “bad” over the past 2-3 weeks. This is because oil prices have fallen about 15% since June 15th, and gasoline prices closely track the price of oil. Similarly, wheat prices are down about 20% since June 15th. Of course, there is no guarantee that these sharp drops will be sustained, but it is a step in the right direction, and it could contribute to a much more encouraging July CPI report.
However you slice it, inflation is still “too high,” both in the eyes of the consumer and the Federal Reserve. This most likely points to continued rate hikes of at least 0.75% per quarter until the numbers come back down to something closer to 2%-3%.
As we mentioned in previous reports, the best way to combat inflation over the long-term is to own stocks in a variety of sectors, because those companies can increase prices. For example, during the latest quarter, PepsiCo (which we own for many clients) only increased unit sales by only 1% year-over-year. However, the company grew its total revenue by 13%, with the difference coming from price increases.
That doesn’t mean that your stocks won’t go down in the short-term – just that companies can pass along higher costs and still grow their profits over time. Short-term stock price movements are a function of emotions and investor psychology, which is why an allocation to a high-quality bond portfolio can help smooth out some of the inevitable bumps along the way.
We hope everyone has a safe and enjoyable Summer and we will be back in October with another update.
Figure 2: Selected Components of the Consumer Price Index (CPI), June 2022